Problems with the NPA's Sequence
of Critical Events
3.11.2009
There would be no point in my doing what I am doing if Tom House
and the
National Pitching Association (NPA) got everything right.
The problem is that they don't.
The diagram below, which is from
this
page on the NPA web site and which purports to show what
happens when during a throw, is a perfect example of this.
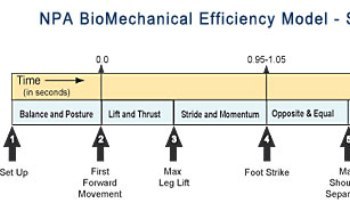
The NPA BioMechanical Efficiency Model
The NPA BioMechanical Efficiency Model
If you compare this timeline to video of the best pitchers in
the world, or really just any higher-level pitcher, it is quite
obvious that there are a couple of significant problems, or
at least departures from reality,
with it.
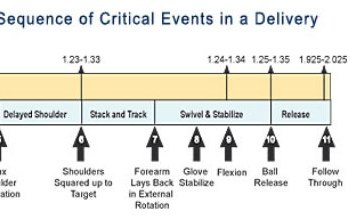
First and foremost, Event
7, in which the forearm lays back into external rotation, is
placed much too late in the process. In truth, in most cases the
forearm starts to lay back into external rotation at, or soon
after, Event 4 when the Glove Side (GS) foot strikes. Even if
the implication is that the marker for Event 7 represents the
moment when the external rotation is completed, this is still
wrong. In most cases the external rotation of the Pitching Arm
Side (PAS) upper arm is completed before or as the shoulders
square up to the target.

Roger Clemens
Second, it's physically impossible, in a high-level
throw at least, for the shoulders to rotate 90 degrees and to
square up to the target without any external rotation occurring.
The rapid rotation of the shoulders causes the PAS upper arm to
externally rotate and the PAS forearm to lay back.
This isn't just an academic,
technical point.
This model represents
the NPAs understanding of what happens when during a throw. As their web
site makes clear, they are instructing and evaluating pitchers
according to this model. Unfortunately, this model is
flawed. As a result any advice based upon it is at least
highly suspect if not actually dangerous due to the chance
that it will encourage the creation of timing problems in
pitchers.
If you are interested in
understanding what actually happens when during a high-level
throw, then I suggest that you read my piece that lays out a
Revised Baseball
Pitching Cycle.
Postscript
I have already had people write me and tell me that I'm
misinterpreting the NPA's diagram. They say I should pay more
attention to the time stamps than the position of the arrows on
the diagram.
My response is that
doing that won't solve the problems with the diagram.
First, the meaning of the timestamps aren't at all clear. I
believe that the timestamps represent the range during which
that even either starts or finishes rather than the elapsed time
it takes for the movement to occur. For example, that means that
Event 6, where the shoulders square up to the target, generally happens
between 1.23 and 1.33 seconds after the first forward movement.
Second, the scale (timeline) of the diagram is arbitrarily
stretched and compressed at different points. For example,
compare Event 6 which occurs at 1:23-1:33 and Event 9 which
occurs at 1:24-1:34. In that case 1/100 of a second is
represented by 1.25 inches. However, elsewhere on the chart the
same horizontal distance, from Event 2 to Event 4, represents a
full second. You can also see this by comparing the distance
from Event 2 to Event 4, which represents 1 second, and the
distance from Event 4 to Event 11, which also represents 1
second. You can see that those are two very different horizontal
distances.
You can't stretch the X axis like that and not
expect to confuse people.
Third, regardless of the issues with the timestamps and the scale, the
fact is that Event 7 is out of sequence. In the case of most
good, durable pitchers, the forearm lays back into external
rotation at foot strike (Event 4) and finishes laying back into
external rotation by the time the shoulders square up to the
target (Event 6). At or shortly after Event 6 the Pitching Arm
Side upper arm actually goes into internal rotation.
I'm not sure if
the issue is that the diagram is wrong or just really poorly
designed, perhaps out of a design to make things fit into a
model of a linear series of discrete events. Regardless, people
who try to teach according to it are going to be very confused
and will likely draw some very wrong conclusions.
I'm trying to come up with a diagram that more accurately reflects
what happens during a throw (and that uses the NPAs time stamps
as a starting point). One of the ways I'm going to do
that is by...
- Allowing for more than one thing to happen at a moment
in time.
- Illustrating things as long-duration events rather than
discrete moments in time.
- Maintaining a consistent timeline.
|